🧠 Project Overview
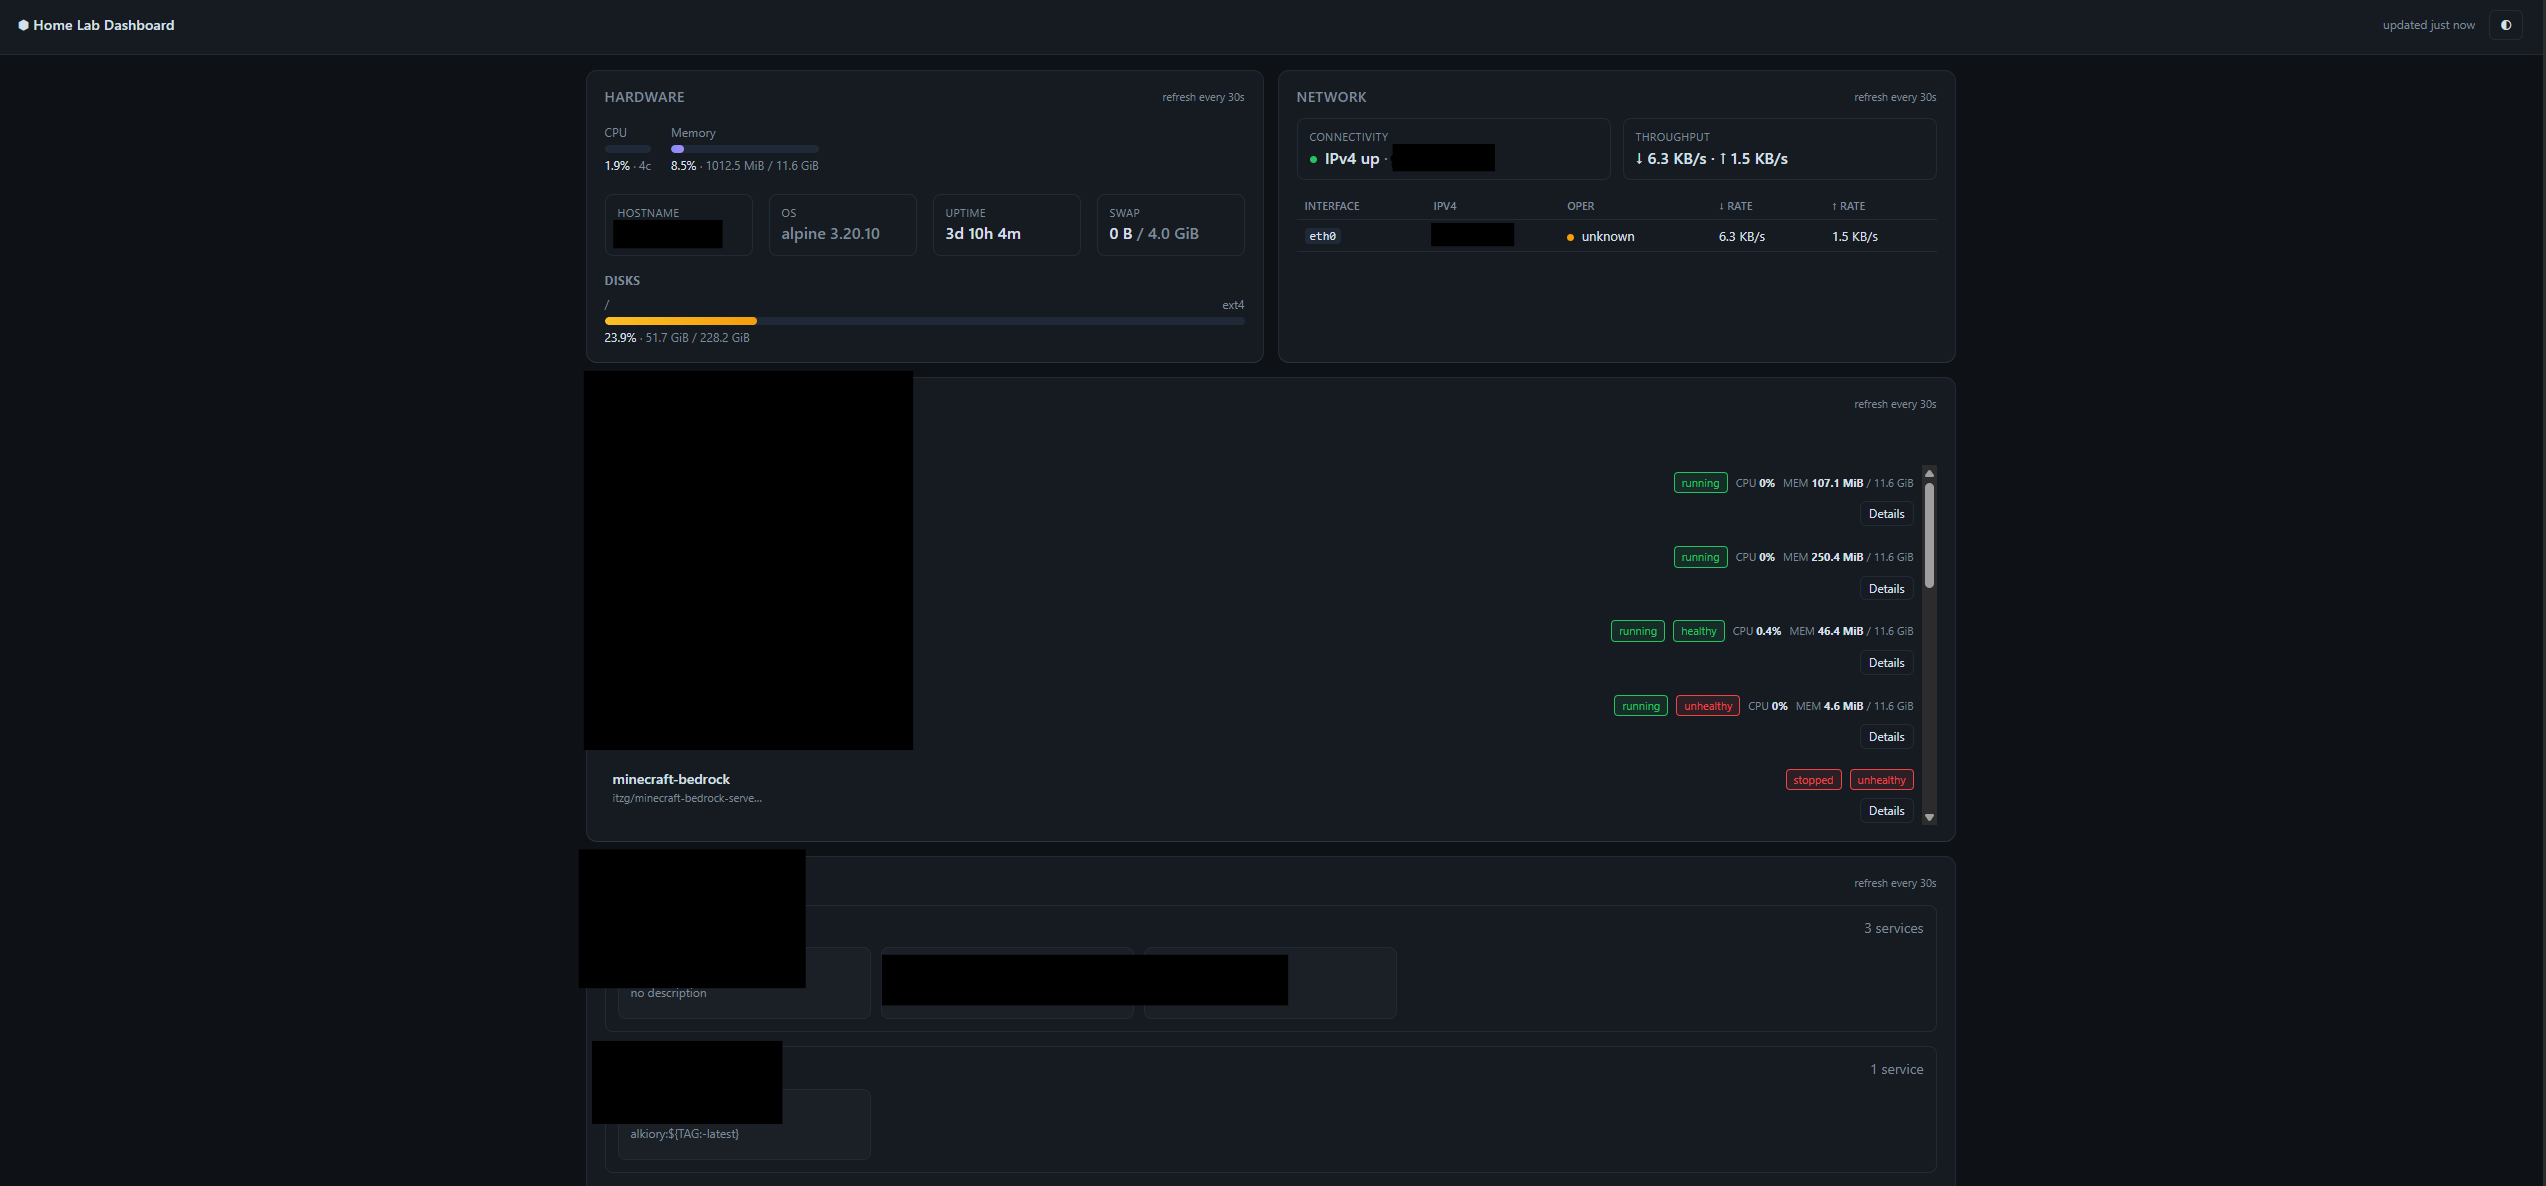
Goal: give a home lab host a single page that answers the four questions I keep asking it — is the host alive, is the network alive, are my containers healthy, what am I actually running — and nothing more than that. No historical graphs, no alerts, no agent fleet.
Current Features:
- Four auto-refreshing cards: Hardware (CPU, memory, swap, disks, optional temperature), Network (interfaces, link state, addresses, bandwidth rates, public IP), Containers (state, health, CPU/memory, inline start/restart/stop), and Services (Compose projects with metadata labels).
- Self-hosted single Go binary, no SPA, no database, no third-party browser dependency.
- Docker is treated as optional — if the daemon disappears, the Containers card keeps the last good list and marks it stale instead of blanking out.
- Configurable environment variables for polling cadence, exposed port, title, log level, public-IP toggle, and the Compose-scan paths to walk.
🏗️ Architecture: Snapshot + Poller
The runtime is a single goroutine of work plus an atomic swap and a read-only HTTP layer on top.
graph LR
  H[Hardware collector] --> P[poller.tick<br/>POLLING_INTERVAL]
  N[Network collector] --> P
  D[Docker collector] --> P
  Y[Compose discovery] --> P
  P --> S[snapshot.Store<br/>atomic Swap]
  S --> R[HTTP handlers<br/>read-only]
  R --> B[Browser fetch poll<br/>every N seconds]
This structure allows us to:
- Keep the only mutable shared state in one place —
snapshot.Store— guarded by a single writer (the poller). - Render HTTP responses from an immutable snapshot built fresh on
every tick; handlers never call Docker,
/proc, or external IP services directly. - Recover gracefully from a Docker outage: the last good container list stays in the snapshot and is re-rendered with a stale badge.
- Wait out cold starts cleanly:
/readyzreturns503 priminguntil the first tick completes, so a reverse proxy can hold health checks without ever serving a half-initialized page.
🧰 Technologies Used
🔙 Backend (Go standard library)
- Go 1.25 with
net/http,html/template,embed.FS, andlog/slogfrom the stdlib. No web framework, no template engine, no asset sidecar. gopsutil/v3 v3.24.5for hardware (CPU, memory, swap, disk, uptime) and network (interface counters, addresses) metrics.- Docker SDK
v25.0.6+incompatiblefor container state, health, and one-shot stats — read through a TCP socket proxy, never the raw socket. gopkg.in/yaml.v3 v3.0.1for the Compose-file scanner (compose.yml,compose.yaml,docker-compose.yml,docker-compose.yaml, depth-3, symlinks skipped).
🎨 Frontend (vanilla JavaScript + handcrafted CSS)
- One HTML template (
layout.html) plus four card partials inweb/templates/partials/. - Handwritten CSS in
web/static/css/app.css. - Vanilla JavaScript in
web/static/js/app.js: a smallsetIntervalpoller that calls the four/api/cards/*endpoints withfetch()and replaces the card innerHTML. - No React, no HTMX, no framework, no build step.
📦 Infrastructure and Deployment
- Multi-stage
Dockerfile: Go 1.25 builder,alpine:3.20runtime with embedded assets and a non-rootappuseraccount. Final image is roughly 22 MB compressed; resident memory under 50 MB. docker-compose.ymlrunning throughtecnativa/docker-socket-proxyso the dashboard never touches/var/run/docker.sockdirectly. Compose scan mount is read-only (/home/alkiory/projects:/projects:ro).- Network: external
npm_networkshared with the rest of the homelab, the same as Nginx Proxy Manager. - No persistent storage, no migrations, one volume-less container per host.
🌐 User Navigation and Flows
graph LR
  GET_ROOT["GET /"] --> LAYOUT["layout.html<br/>full rendered"]
  GET_HW["GET /api/cards/hardware"] --> PARTIAL["card partial"]
  GET_NW["GET /api/cards/network"] --> PARTIAL
  GET_CT["GET /api/cards/containers"] --> PARTIAL
  GET_SV["GET /api/cards/services"] --> PARTIAL
  GET_HEALTH["GET /healthz"] --> OK["ok"]
  GET_READY["GET /readyz"] --> READY["ready / 503 priming"]
🧭 Cold-start sequence:
graph LR
  A["main: config.FromEnv"] --> B["init snapshot.Store"]
  B --> C["launch poller.Run"]
  C --> D["tick #1: prime snapshot"]
  D --> E["/readyz 503 priming"]
  E --> F["tick completes"]
  F --> G["/readyz 200 ready"]
🔐 Key Technical Decisions
✅ 1. Snapshot + Poller over direct handler calls
The first version bound Docker SDK calls straight into HTTP
handlers. Every browser refresh hit the socket proxy at 100% CPU.
Moving the collection into a single goroutine that atomically
swaps snapshot.Snapshot reduced RSS from pegged to under 50 MB
and removed flicker.
✅ 2. Docker is a guest of the host, not a friend
The dashboard talks to Docker only through a TCP socket proxy
(tecnativa/docker-socket-proxy). Mounting
/var/run/docker.sock directly would mean a bug in the dashboard
is a bug in the host; the socket proxy keeps that surface narrow
and inspectable.
✅ 3. The four cards are the entire feature surface
A historical-graph view, an alerting pipeline, and an agent fleet are out of scope. A home lab does not need Datadog; it needs the only browser tab you keep open.
📊 Data Visualization and Card Contents
Each card pulls straight from the snapshot. There is no “dashboard-as-config” — the cards have a fixed shape and the poller decides what fills them.
- Hardware: CPU model and utilization, memory and swap usage,
per-disk usage filtered for virtual filesystems, hostname, OS,
uptime. Temperature from
/sys/class/thermal/*on Linux when readable from inside the container. - Network: per-interface counters, current up/down state
from
/sys/class/net/*/operstate, link addresses, and bandwidth rates diffed against the previous tick. Public IP is cached for 60 seconds and disabled withENABLE_PUBLIC_IP=0. - Containers: listing with state, health, and the last
observed CPU/memory snapshot. Inline
start/restart/stopbuttons; the server enforces a 20-second timeout per action. - Services: Compose projects discovered from the configured
scan roots with metadata sourced from
dashboard.*/homelab.*labels. Onlyhttp:andhttps:URLs are rendered as links.
📈 Current Outcome
✔️ Single-binary service in production across multiple home lab hosts.
✔️ Cold-start path verified end-to-end — Docker socket-proxy is
ready before /readyz returns 200.
✔️ Outage contract verified: Docker daemon restarts do not blank the Containers card; the proxy going down is recoverable without restarting the dashboard.
✔️ Build is reproducible: go build . from Go 1.25 reproduces
the binary byte-for-byte against the vendored lockfile.
📎 Conclusion
hm-dashboard proves you can self-host a single page that covers the four questions a home lab actually gets asked, with one Go binary, no SPA, no database, and a Docker-as-optional contract that holds even when Docker is the very thing being monitored.
The architectural choices — single goroutine for data collection, atomic snapshot swap, read-only HTTP handlers, vanilla JS front-end, behind a TCP socket proxy — were driven less by novelty than by the simple rule that the card that goes blank when Docker hiccups is exactly the card you needed most.
Want to read the source or run it on your own home lab?
🧠 Interested in a similar stack?
If you are spinning up your own home lab dashboard and want to talk about the poller-only-writer contract or the Compose label convention, feel free to reach out 🚀